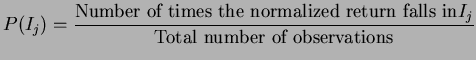
We construct the probability distribution ![]() for the normalized returns using the relative frequency
definition. We study all the sensex scrips and two scrips not in sensex but
in the rolling settlement. We take the adjusted daily prices and compute the
returns as indicated earlier. The data used is for the period 1 January 1998 till
31 December 2000 for sensex scrips and 1 April 1999 till 31
December 2000 for those in the rolling settlement.
for the normalized returns using the relative frequency
definition. We study all the sensex scrips and two scrips not in sensex but
in the rolling settlement. We take the adjusted daily prices and compute the
returns as indicated earlier. The data used is for the period 1 January 1998 till
31 December 2000 for sensex scrips and 1 April 1999 till 31
December 2000 for those in the rolling settlement.
For each scrip we take the normalized returns (the difference in closing prices of today and yesterday normalized by yesterday's price) and compute the relative frequency distribution as follows.
The normalized returns are put in bins of length 0.002 (so that the interval [-1,1] is broken up in to equal subintervals of length 0.002 (there will be 1000 of them). We note here that strictly speaking we should not restrict ourselves only to the interval [-1,1], however, in practice the normalized returns never exceeded the value 1 in modulus, so this is fine.
To each of these subintervals ![]() we assign the value
we assign the value
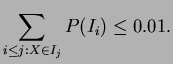
Using this distribution ![]() for each scrip we compute the VaR for each of them,
namely
for each scrip we compute the VaR for each of them,
namely
![]() is computed as the largest number
is computed as the largest number ![]() such that
such that
We have done this construction as a first approximation to study the qualitative behaviour of the returns distribution, to further model it and study it. However the result was so surprising that this procedure is sufficient to observe the significant qualitative feature of the returns.