Perhaps the simplest non-linear maps for illustrating chaotic behaviour are the maps of the Logistic Family, having the form:
xn+1 = f(xn) = a xn (1 - xn)
For each value of the parameter a, there is a different map f.
For values of a chosen between 0 and 4, f(x) is a map from the interval [0,1] to itself.
| Graphical Iteration |
In graphical iteration we draw a `cobweb diagram': we begin at the point x0 (the initial condition) on the x-axis. Then, from the current point xn on the orbit, we
The picture illustrates graphical iteration of f with
a=2.5 for initial value x0=0.1.
The applet performs a fixed number of iterations for a chosen initial point (and chosen parameter value), with the final few iterations shown in red to help detect periodic orbits (cycles).
| a | |
| x0 |
The horizontal slider controls the initial point x0. The vertical slider controls the parameter value a.
Examples
Shown below are some examples of the behaviour
| 2-cycle | 4-cycle | 8-cycle |
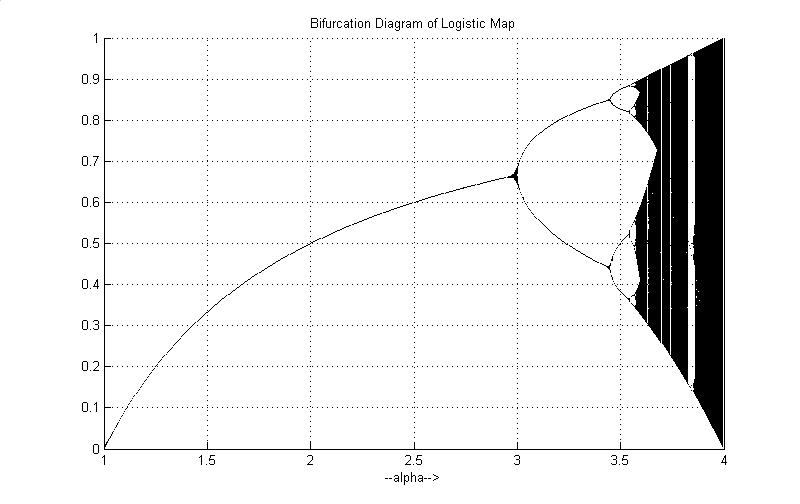
The plots show orbits being attracted to a (stable) 2-cycle,
4-cycle, and 8-cycle (shown, approximately, in red). These three images
form part of the period-doubling cascade, in which an infinite sequence
of attracting 2n-cycles is observed for increasing values of
the parameter.