Evolving Stable Ecological Networks
Chris Wilmers
Department of Environmental Science, Policy and Management
University of California at Berkeley,California, USA
Sitabhra Sinha
Department of Physics, Indian Institute of Science,
C V Raman Avenue, Bangalore, India.
sitabhra@physics.iisc.ernet.in
Markus Brede
Institute of Theoretical Physics, University of Leipzig,
Leipzig, Germany.
markus.brede@itp.uni-leipzig.de
Abstract
We look at how ecological communities can be assembled over time subject to the restriction that they be stable against perturbations. In particular we focus on the question of whether increasing diversity in ecosystems leads to greater probability of the occurrence of instability. We conclude that a positive correlation exists between the occurrence of communities with large average size (large diversity) and decrease in their normalized fluctuations over time (high stability). This contradicts the general conclusion that increasing diversity leads to instability. We also look at food web models, and find that the prevalence of predator-prey type interactions leads to greater stability of the community.
Introduction
In 1972, Robert May showed that randomly generated food webs decreased in stability as they increased in complexity. This result was paradoxical to many ecologists who experienced the opposite pattern in nature. This is the basis for the long-standing diversity vs. stability debate in ecology. Recently, ecologists have revisited this question by exploring the dynamics of interactions, examining the stability properties of more realistic food web configurations and adding hierarchical structure to food webs. In a recent paper published in Nature, McCann et al analyzed realistic dynamic food web configurations and showed that weak to intermediate links between species tended to dampen oscillations between consumers and resources, thus promoting stability. Although this is one of several attempts to answer May’s paradox, it is only a beginning - for the largest food web they considered contained only four species. McCann’s work is a step in the right direction but it follows in May’s flawed approach by not taking into account assembly of real ecological communities.
While real food webs are not subject to the rules of natural selection and genetic drift that govern evolution at the level of the individual (it would be hard to imagine two food webs competing against each other), their composition at one instant in time is dependent on the previous compostion and so they can be thought to evolve through time. By building ecosystems from the ground up, as might occur in nature following a disturbance, we hope to build more realistic complex webs that may shed new light on the diversity-stability debate.
Methods
We begin with one species. We then add further species with a poisson(l ) distribution of links and randomly chosen interaction strengths from a normal(0,s ) distribution. The parameter l is proportional to the number of species N(t) at any given time, that is
l
(t) = kN(t) where k is taken to be 0.11 for the simulations reported in this paper. This agrees with empirical data on directed connectance from real ecosystems. We then analyze the stability properties of this system. This is done by calculating the eigenvalues of the community matrix. We use the condition that if the real part of the dominant eigenvalue is greater than zero, then the equilibrium point at which the community exists is unstable. If it is unstable, we kill a species at random. Conversely, if it is stable, we add another species to the mix with a poisson distributed number of links and randomly chosen interaction strengths. We then analyze the stability properties of the system and repeat the above process.The network properties of the resultant community networks were then analayzed. In particular we looked at the average shortest path length between any two species, the cliquishness, defined as the ratio of the actual number of links among nearest neighbors (directly interacting species) of a given species to the total number of such possible links, and the degree of clustering in the matrix as a whole. We also investigated the time series of the size of the community as it developed. In particular we looked at the communtiy size distribution for different values of the parameter s , the power spectrum of the time series, and the frequency distribution of extinction cascades.
We also looked at food webs, a subset of ecological networks. Whereas ecological networks allow all possible interactions such as competitive (-/-), mutualistic (+/+), and predator prey (+/-), food webs are typically characterized by predator-prey interactions. We thus build these food webs, in the same manner as aforementioned ecological networks, and explore their stability properties.
Results
Figure 1 (top) shows a typical time series for communty size for s = 0.65. We see that the community initially grows monotonically and then settles into a pattern of growth spurts and collapse. Figure 1 (bottom) shows the power spectrum for this time series. The graph is characterized by a power law with exponent a » -3 for a range of values of s . Although the time series looks similar to a random walk (for which a » -2), this exponent shows that the process of community growth and collapse is more correlated.
Figure 1
(top) Time series of community size, N(t), and, (bottom) power spectral density of the corresponding time series.Figure 2 (top) shows the size distribution of the communities for various values of the parameter s . The peak of the distribution shifts to higher values as s decreases. This indicates that communities with weaker interactions can support a larger number of species. From the distribution, we obtained the mean and the standard deviation of the community size for various values of s . We then calculated the coefficient of variation (i.e., the ratio of the standard deviation to the mean), which is a kind of standardized measure of fluctuation in community size over time. This measure is plotted against the mean community size in Figure 2 (bottom). It is interesting to note that communities with larger mean size also tend to have a lower coefficient of variation, which is a measure of the stability of the system. This allows us to conclude that more diverse ecosystems (in the sense of having a larger mean number of species) are more stable, in the sense that they have lower normalized fluctuations in community size compared to the less diverse ones. Although the measure of stability that we have used is different from that used by May, it is no less an indicator of the system’s robustness against perturbation. While our systems are stable in the sense of May by the very nature of their construction process, this result allows us to see that diversity and stability can be positively correlated – which contradicts the general conclusion that increasing diveristy leads to greater instability of the system.
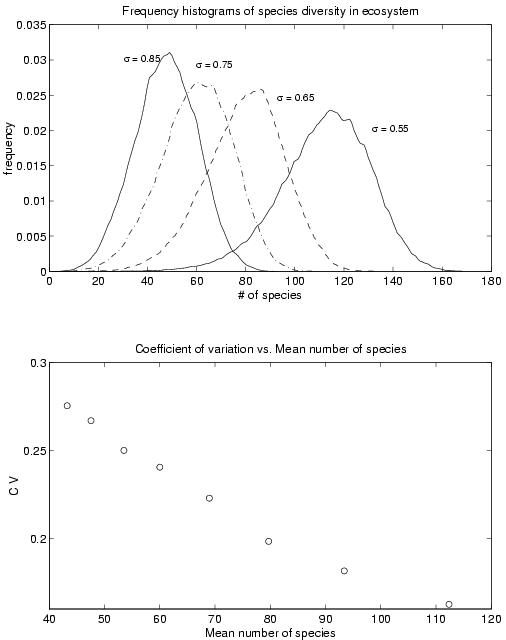
Figure 2
(top) Size distribution of communities and (bottom) the coefficient of variation plotted against the mean community size.We also looked at the size distribution of the species extinction cascades. This generally showed a power law variation with exponent b (< 0) over one decade followed by an exponential cut-off, due to finite-size effects. The absolute value of the exponent b appeared to decrease in value with increasing s . Note that a larger absolute value of the exponent indicates smaller frequency of occurrence of large cascades – so that the system is more resistant. This agrees with our above result, in that communities with weaker interactions between the species are more resistant to perturbations.
We also looked at the network properties as mentioned in the previous section. However, for the parameter range studied in this paper, we could observe no significant deviation from randomly constructed networks.
For food webs, i.e., ecological networks with only predator-prey interactions, we observed how the probability of generating a stable community matrices changed with increasing values of s as compared to networks where all types of interactions were allowed. Figure 3 shows the transition from the situation where we get mostly stable community matrices to the situation where they are mostly unstable. As is clearly seen the transition occurs at a much higher value of s (» 0.9) for food webs than that for ecological networks (s » 0.3). This indicates that allowing only predator-prey interactions makes a community far more stable than it would have been otherwise.
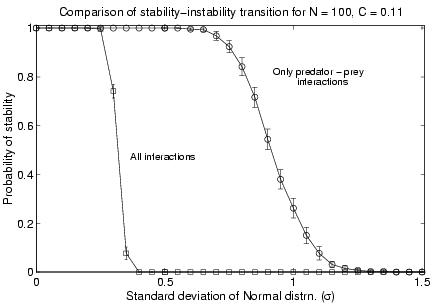
Figure 3
Comparison of the stability-instability transition between ecological networks (squares) and food webs (circles).Conclusions and Future Directions
We have shown that a simple modifications of May’s original model leads to the conclusion that increasing biodiversity is related to increasing stability. By adding a degree of ecological realism to the model, i.e., building food webs from the ground up, and manipulating a parameter s , which is a measure of the interaction strength between members of the community, we have shown that increasing mean community size leads to an increase in ecosystem stability.
The model we have studied is a drastic simplification of real ecosystems. In the future, we hope to continue on the present work by adding more realism through the introduction of
Acknowledgements
We would like to thank Mark Newman, John Pepper, Gunther Eble and Sandeep Krishna for helpful comments and suggestions on our work. We thoroughly enjoyed the experience at the Summer School and would like to thank everyone who made it possible, especially the people from the SFI.